View Statistics
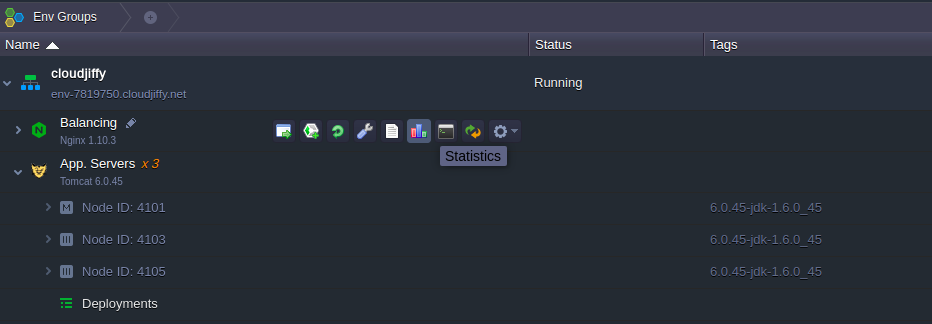
We can track the usage statistics for all the nodes in my environment: application servers, balancers, web servers, and databases. For that, click the corresponding button next to the desired instance (or set of the same-typed ones):
In the opened tab We’ll find the statistics on all the types of consumed resources and their limits:
- RAM - memory consumption (in Mb)
- CPU - processor load (in MHz)
- Network - internal and external traffic (in Mb)
-
Disk - stored data amount (in Mb) and I/O operations amount (in IOPS)
Herewith, the RAM and CPU limits depend on the number of cloudlets We’ve allocated for a node, while our hosting provider defines the Network, Disk, and IOPS ones.
We can further analyze the presented statistics by varying the interval and duration settings and enabling/disabling the particular sections at the top tools panel:
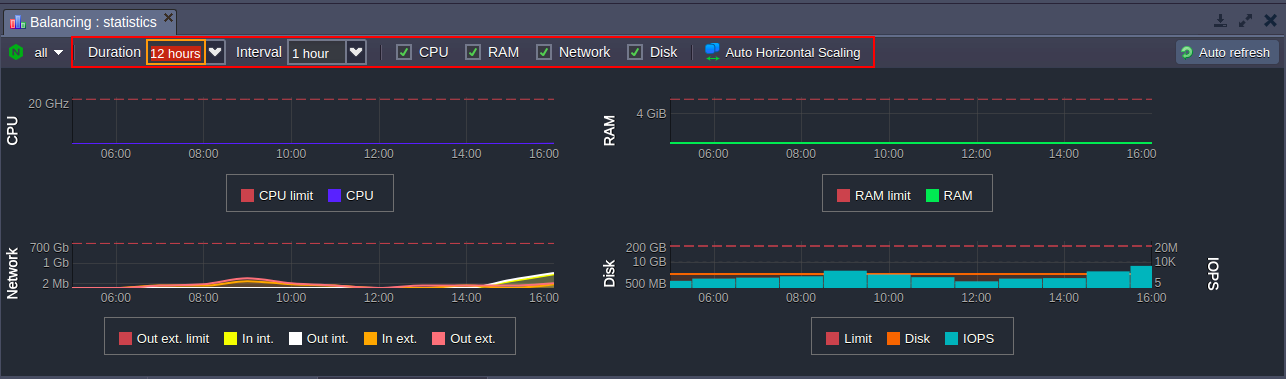
Tip: hover over the desired graph for detailed information for a particular time frame.
Using the statistics data We can easily track the resource consumption of my application, thus analyze and predict my future spending and, as a result, we will be able to choose the best way to manage my environment. For even more convenience, we can configure the set of load alerts to be notified about the consumption level growth or wane to the specified percentage via email. This can greatly help us to save money!
To get additional information on resource charging, see the corresponding document.
The Input/Output Operations per Second amount monitoring is a very common and popular storage measurement method, which helps to analyze the container’s efficiency based on its ability to handle a particular number of reading and write operations simultaneously without performance degradation.
Note that currently IOPS statistics for the Windows-based nodes are not provided.
1. IOPS data is shown within the Disk statistics section using the second axis to the right of the graph (we’ve disabled all the rest of the sections to concentrate on the information we are interested in):
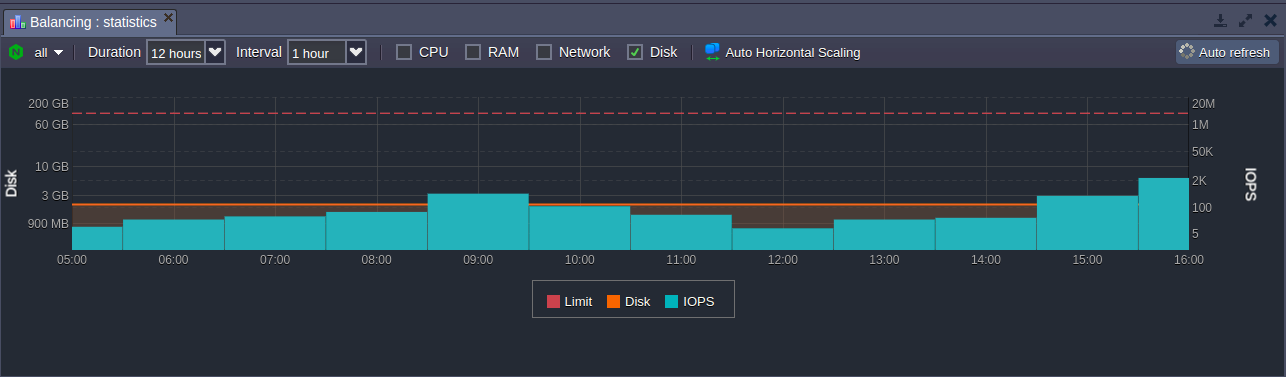
The more operations are handled - the higher the system load is. Thus, to avoid hardware efficiency degradation, the allowed IOPS amount is limited - the appropriate threshold (defined by our hosting provider) is marked with the red dotted line at the top of the graph.
Reaching this point implies that the performance of our container can be negatively affected, so it is needed to enlarge the number of servers used or to optimize the application itself.
2. Upon hovering over the particular point at the Disk/IOPS graph, We’ll see the popup tooltip with the following details:
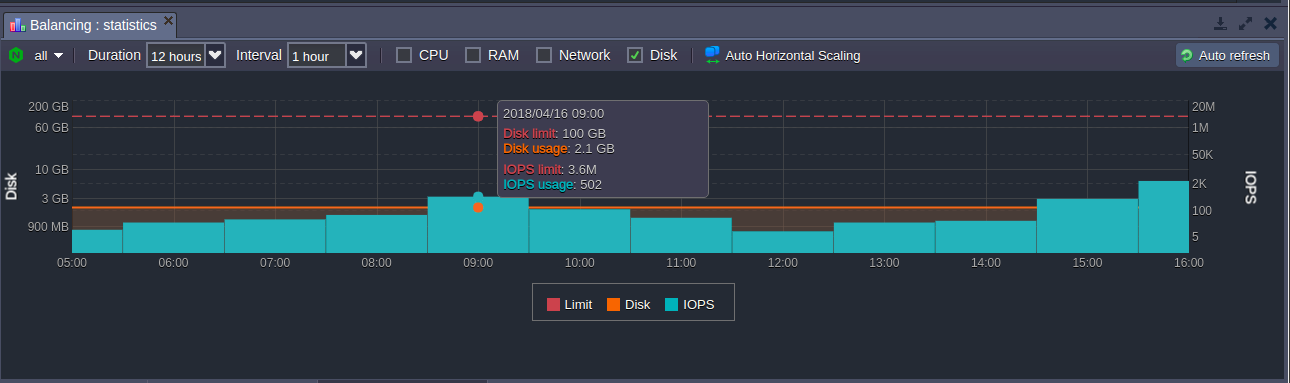
- date and time of the gathered stats
- Disk - the amount of space the container is using
- Disk space limit - the maximum amount of data that is allowed to be stored in a container
- IOPS - the number of I/O operations handled during the stated Interval
- IOPS limit - the maximum number of I/O operations, allowed to be performed by the container during the stated Interval
3. As it was mentioned above, the IOPS limit depends on the Interval chosen. So, for example, if I state a 1-hour Interval for our environment, the prior limit for 1 minute (which is equal to 6000 - see the image in the previous step) will be increased 60 times (as 1 hour = 60 minutes):
6000 * 60 = 360 000

In such a way, we can provide the actual disk load information and get the ability to monitor its state in real-time.
That's All!